


Live events rarely fail because the video was bad. They fail because the pipe was too small at the one moment everybody arrived. Planning live streaming bandwidth is therefore less about averages and more about a single question: how many people will be watching at the busiest minute, and how much data does each of them pull per second?
The arithmetic is short. Peak bandwidth in gigabits per second (Gbps) is your peak concurrent viewers multiplied by the stream bitrate in megabits per second (Mbps), divided by 1,000. The hard part is that each of those inputs hides a decision: which viewer count, which bitrate, and how much margin. This guide walks through the formula, the three inputs, three worked events, origin and ingest sizing, and a checklist for the week before you go live. Our event bandwidth calculator does the multiplication for you, but you still have to feed it sensible numbers, and that is what this article is for.
The Core Formula: Viewers × Bitrate
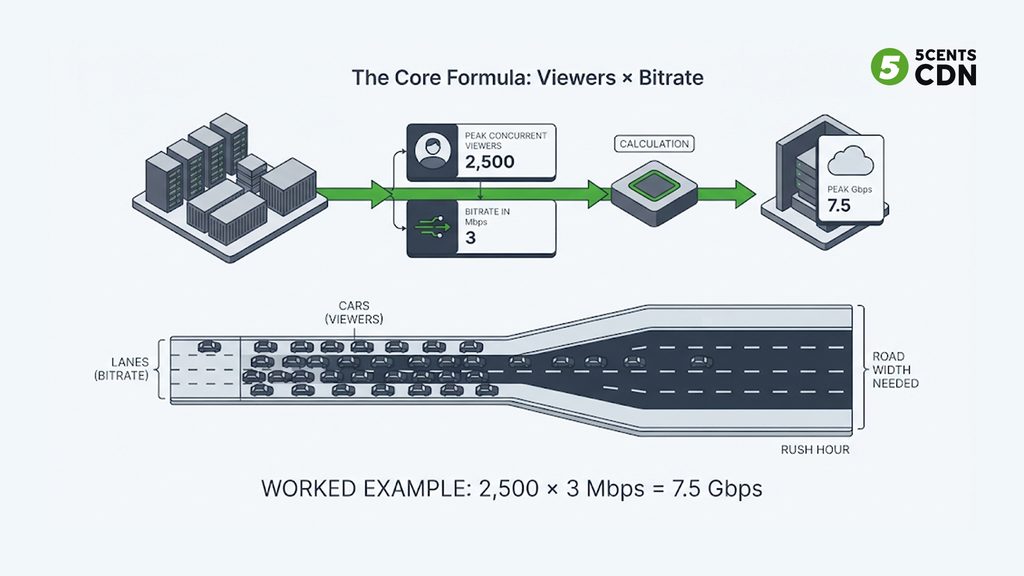
peak Gbps = peak concurrent viewers x bitrate (Mbps) / 1,000
Example: 2,500 viewers x 3 Mbps = 7,500 Mbps = 7.5 Gbps
Think of a motorway at rush hour. Each viewer is a car, and the bitrate is the width of the lane that car needs. The road has to be wide enough for the busiest rush hour of the year, not for the average Tuesday. A road that handles the daily average will jam solid the first time a big event lets out.
Two details keep the formula honest. First, units: a bit rate is measured in bits per second, and 1 Gbit/s equals 1,000 Mbit/s in the decimal units used for network capacity, so the divide-by-1,000 is exact. Second, one viewer means one stream. A second device in the same household is a second viewer as far as your delivery network is concerned.
Peak Gbps is not the same as total terabytes
Peak bandwidth is a rate. It sizes the pipe. Total data transferred is a volume. It sizes the bill and your monthly allowance. The two are easy to confuse, and they answer different questions. The bridge between them is one conversion: a viewer watching a 1 Mbps stream for an hour pulls 0.45 GB (1 Mbit/s × 3,600 seconds ÷ 8 bits per byte ÷ 1,000), so GB per viewer-hour is simply the bitrate in Mbps times 0.45.
| Bitrate | GB per viewer-hour | Gbps per 10,000 viewers | Typical use |
|---|---|---|---|
| 1.5 Mbps | 0.675 | 15 | 480p |
| 3 Mbps | 1.35 | 30 | 720p |
| 6 Mbps | 2.7 | 60 | 1080p |
| 15 Mbps | 6.75 | 150 | 4K |
The bitrates in the last column are indicative and move with the encoder, the codec and the content. Fast sports footage needs more bits than a talking head at the same resolution, so treat them as starting points, then check them against your own encoder output. A broader look at how bitrate, resolution and quality interact is in our guide to streaming bitrate settings.
Input 1: Peak Concurrent Viewers
The number that matters is not total views, unique visitors or registrations. It is the most people watching at the same moment. A one-hour webinar with 10,000 registrants might peak at a fraction of that, while a free public match can peak well above its pre-registered audience. The formula needs the peak, and the peak is a single minute on a graph.
Because you are forecasting a future audience, you will be wrong, so the practical goal is to be wrong in a safe direction. Three approaches help:
- Use your own history. For a comparable past event, divide peak concurrent viewers by registrations (or by page visitors, or by notification recipients) to get a ratio of your own. Your ratio is worth more than any industry average, because it reflects your audience and your promotion.
- Build a funnel, then widen it. Invited audience × expected sign-up rate × expected attendance × share watching at peak. Each term is a guess, and guesses multiply, so give each a low and a high value and see how far apart the answers land.
- Plan three scenarios. A base case, a stretch case and a surge case. Size capacity for the stretch case, and decide in advance what you will do if the surge case arrives, which is the subject of the headroom section below.
Watch for three things that inflate a peak beyond the forecast: embeds on third-party sites that send visitors you did not count, push notifications that make everyone join in the same minute, and social sharing during the event itself. They all arrive during the event, so none of them shows up in registrations.
Shape matters as much as size. Audiences do not trickle in. They arrive in a wave at the start, and again at key moments such as kickoff, a keynote or a final. Geography matters too. If the audience is spread across continents, the peak on each region’s network is what you need, and our guide to regional CDN performance covers why a global total can hide a local bottleneck.
Input 2: Which Bitrate Do You Plug In?
Adaptive bitrate streaming means you do not deliver a single bitrate. You deliver a ladder of renditions, and each viewer’s player picks one rung at a time based on their connection and device. Because each viewer takes one rung, a ladder does not multiply your delivery bandwidth by the number of rungs. It multiplies the work on the encoder and transcoder side, which is why live transcoding capacity and your encoding ladder are planned separately from delivery.
That leaves a real choice about which number represents the audience. There are two honest answers, and they are not interchangeable.
- Top rung for everyone (conservative). Multiply every viewer by your highest bitrate. This is the safest planning number, and it is what the event calculator does. It overstates the real load whenever some of the audience is on slower connections or smaller screens.
- The weighted average (realistic). Weight each rendition by the share of viewers on it. This is the number to use once you have data from a comparable event, ideally from your CDN logs grouped by rendition.
Here is the difference on a plausible mix. Suppose 40% of viewers are on a 6 Mbps rendition, 35% on 3 Mbps and 25% on 1.5 Mbps. The weighted bitrate is 0.40 × 6 + 0.35 × 3 + 0.25 × 1.5 = 3.825 Mbps, about 36% lower than planning everyone at 6 Mbps. (The mix is an illustration, not a benchmark, so replace it with your own.)
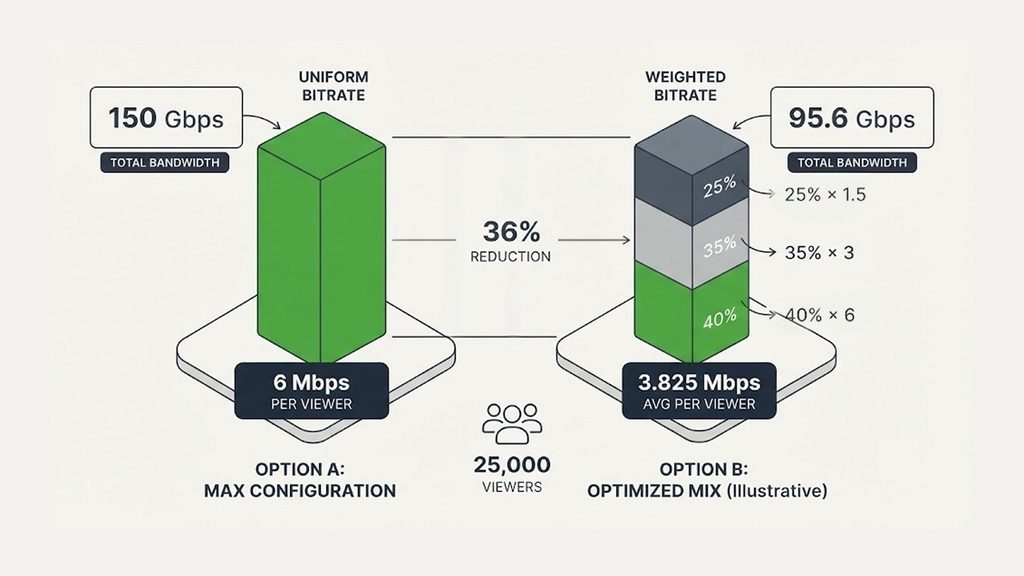
Be careful before you plan to the lower number. A marquee event can attract an audience that skews towards large screens and fast connections, so your ordinary weekday mix may understate it. If you cannot repeat the event, planning to the conservative number is cheap insurance.
Details that move the bitrate
- Audio counts. The stream’s total bitrate includes audio. A 128 kbps audio track adds 0.128 Mbps per viewer, small on its own and real at 100,000 viewers.
- Peak versus average inside the stream. Live encoders are usually run at a constant bitrate so the output stays predictable, but check the encoder’s actual output rather than its target. In HLS, the RFC 8216 playlist specification defines the BANDWIDTH attribute of a variant as its peak segment bit rate, and the optional AVERAGE-BANDWIDTH attribute as the average. If you read your own master playlist, the BANDWIDTH value is the higher of the two.
- Overhead. Packaging and network framing add bytes on top of the media bitrate, and the size of that overhead depends on the format. Check whether your CDN counts media payload or on-the-wire bytes, and add a margin for it in the plan.
- Extra tracks. Alternate audio languages, captions and thumbnails each add a little. They matter when the audience is huge.
Input 3: Headroom and the Join Surge
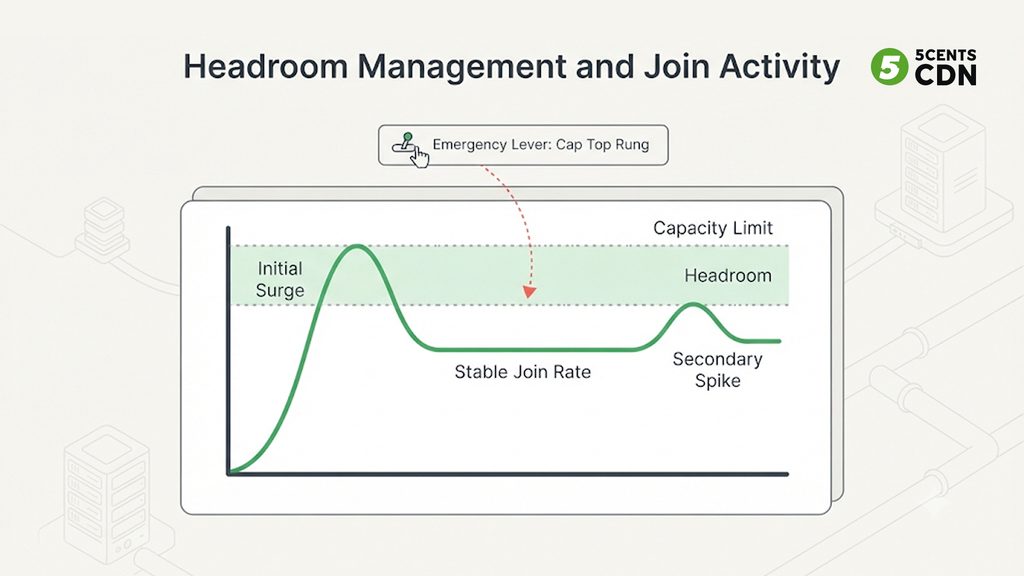
Peak Gbps from the formula is a steady-state figure. Real traffic overshoots it in short bursts, for reasons that are mechanical rather than mysterious:
- Players fill their buffer faster than real time. When a viewer joins, or recovers from a stall, the player downloads segments as fast as the network allows until its buffer is full. A wave of joins therefore pulls more than the steady bitrate for a short while.
- Everybody wants the same segment at once. In HLS and DASH, every segment is an ordinary HTTP request. When thousands of players ask for the newest segment within the same few seconds, edge nodes that do not have it yet all reach back for it, which is the origin-side problem described below.
- Bitrates are averages. Individual segments in busy scenes are larger than the stream’s average, and across a large audience those peaks line up more often than you would hope.
- Failures redirect load. If one delivery path degrades, its viewers move to another, so spare capacity must be held somewhere. See our guides to live stream failover and how platforms crash during live events.
How much margin to add is a judgment call, and the right way to make it is empirical. On a past event, compare your one-minute peak throughput to your five-minute average around it. The gap is your burst factor, and it is specific to your content and audience. Do not stack margins blindly, though. A top-rung plan is already conservative, so adding another 30% on top of it can double-count.
Here is what that looks like for the 25,000-viewer example later in this article. The top-rung number is 150 Gbps. The weighted number plus a 30% burst margin is 95.6 × 1.3 ≈ 124 Gbps, which is lower. Both are defensible. Which one you choose depends on how much risk the event can tolerate.
Have an emergency lever ready
The most useful thing you can have in a surge is a way to reduce load without taking the stream down. The simplest is to remove the top rendition from the ladder mid-event, so the viewers on it step down one rung. In the 40/35/25 mix above, if the 6 Mbps viewers drop to 3 Mbps, the weighted bitrate falls from 3.825 to 2.625 Mbps, about 31% less delivery bandwidth, at the price of some picture quality. Decide in advance who may pull that lever, and at what threshold.
Three Worked Examples
Each example shows two numbers: the conservative top-rung peak, and the weighted peak using the illustrative 3.825 Mbps mix where a multi-rendition ladder applies. Volumes assume everyone watches the whole event, which is an upper bound.
| Event | Peak viewers | Top bitrate | Peak Gbps (top rung) | Notes |
|---|---|---|---|---|
| Corporate town hall, 3 hours | 2,500 | 3 Mbps | 7.5 | Upper-bound volume: 2,500 × 1.35 GB × 3 h ≈ 10.1 TB |
| Regional final, 3 hours | 25,000 | 6 Mbps | 150 | Weighted peak 95.6 Gbps. Upper-bound volume ≈ 202.5 TB at the top rung, ≈ 129.1 TB weighted |
| Marquee event | 100,000 | 6 Mbps | 600 | Weighted peak 382.5 Gbps |
Two lessons come out of the table. First, the gap between “conservative” and “realistic” grows with the audience. At 100,000 viewers it is more than 200 Gbps, which is a very different capacity conversation. Second, peak Gbps and total terabytes diverge quickly. The town hall is a small pipe for a long time, while the marquee event is an enormous pipe for as long as the match lasts. A plan that fits the volume can still fail on the peak.
The Origin Is Sized Differently
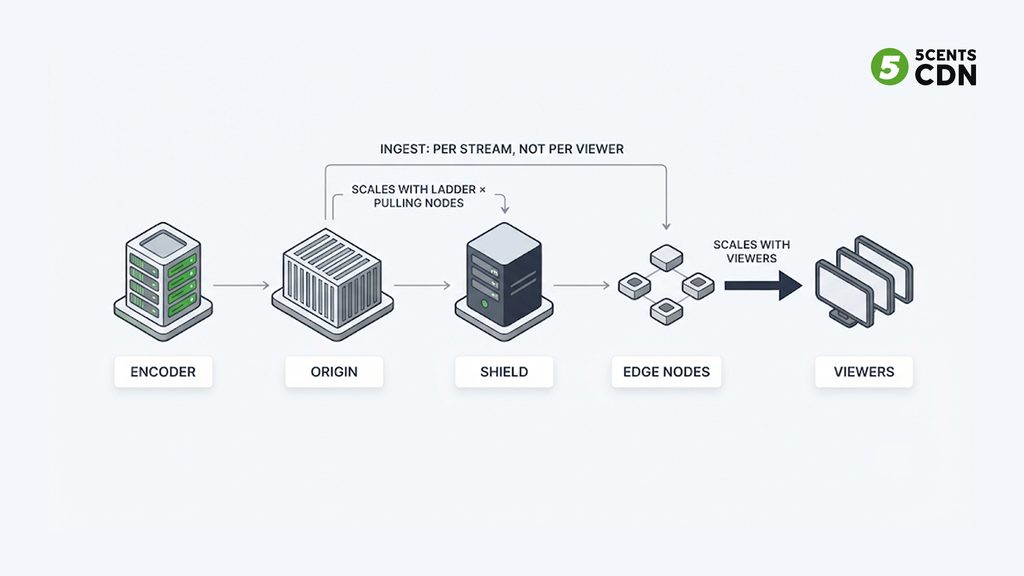
Everything so far describes the edge, the network that serves viewers. Your origin, where the stream is packaged and stored, scales on different logic. In an ideal cache, every new segment is fetched from the origin once per cache layer that asks for it, no matter how many viewers watch. That makes origin load roughly the sum of your ladder’s bitrates multiplied by the number of nodes pulling directly from origin, not a function of audience size.
origin egress ~ (sum of rendition bitrates) x (nodes pulling from origin)
Illustration: ladder of 6 + 3 + 1.5 = 10.5 Mbps, 8 pulling nodes
-> about 84 Mbps, whether 5,000 or 500,000 people are watching
That is why an origin shield matters at event scale: it reduces the number of nodes that pull from origin, collapsing the multiplier. Real life is messier than the model, because caches start cold, content ages out, and long DVR windows spread viewers across old segments and push origin load up, but the model explains why an unshielded origin can fail at an audience size where the edge is perfectly healthy.
Ingest is a separate calculation
Contribution, the feed from your venue or studio to the platform, is per stream and not per viewer. Plan the uplink for the primary feed plus any backup feed running at the same time, with margin, and test it on the real network at the real venue. Redundant ingest is covered in the failover guide linked above, and the infrastructure behind a stadium-scale broadcast is in our look at live sports streaming infrastructure.
Run the Numbers in Minutes
Once you know your inputs, the arithmetic should take a minute, not an afternoon. The 5centsCDN event bandwidth calculator takes your plan, your peak concurrent viewers, your top bitrate and the event duration, then shows the estimated peak in Gbps and whether it fits inside your plan’s included and burst bandwidth. It counts every viewer at the highest bitrate, so treat its answer as the conservative planning number from this guide. If you need total monthly volume rather than the peak, use the bandwidth calculator. For an end-to-end event setup with redundancy and capacity in place, see our live event streaming solution, and for the wider picture of scaling an OTT platform to large concurrent audiences, our guide to CDN for OTT platforms.
A repeatable routine looks like this:
- Estimate three audiences: base, stretch and surge.
- Pick the bitrate method: top rung for a first estimate, weighted average once you have rendition data.
- Compute peak Gbps for each scenario and add margin only once.
- Compare against capacity, including how burst and extra capacity are treated, then write down your trigger for the emergency lever.
- After the event, record the actuals: peak concurrency, rendition mix and one-minute peak egress. These become the ratios that make the next forecast better.
A Pre-Event Capacity Checklist
- Capacity in writing. Confirm your included peak, how bursts above it are treated, how extra capacity is bought and how much notice it needs.
- Regional split. Check capacity for each region, not only the global total.
- Origin protection. Shield enabled, segments cacheable, and cache rules checked on a test stream.
- A realistic test. Run the real encoder, packaging and player path before the event, and watch concurrent sessions, egress and rebuffering together.
- Live dashboards. Concurrent sessions, edge egress in Gbps, cache hit ratio and rebuffer ratio on one screen.
- Alert thresholds. Alert well before capacity, not at it. For example, at 70% and again at 85% of your limit.
- The lever. Ladder cap procedure written down, with an owner.
- Redundancy. Backup ingest and a second delivery path where the stakes justify it.
- Cost expectations. Know the volume the event will add to your monthly total. Our guide to reducing CDN bandwidth costs covers the bill side.
Common Mistakes
| Mistake | What to do instead |
|---|---|
| Planning on registrations or total views | Plan on peak concurrent viewers from a comparable event |
| Mixing up Mbps and MB/s | Network capacity is in bits per second and file sizes are in bytes. Multiply bytes per second by 8 to get bits per second |
| Confusing peak Gbps with total TB | Peak sizes the pipe; total volume sizes the bill. Calculate both |
| Planning for the average hour | Plan for the busiest minute, including the join wave |
| Stacking a conservative bitrate and a large margin | Choose one conservative lever, not two |
| Forgetting audio, extra tracks and overhead | Add them explicitly to the per-viewer figure |
| Sizing the origin by audience | Size it by ladder and pulling nodes; protect it with a shield |
| Ignoring regional peaks | Check capacity per region |
Where 5centsCDN Fits
5centsCDN’s plans include a peak bandwidth allowance plus a free burst on top: the Standard plan includes 5 Gbps with free burst up to 10 Gbps, and the Enterprise plan includes 25 Gbps with free burst up to 30 Gbps. Above that, extra peak capacity is bought in 5 Gbps slots for the hours of your event, with bandwidth included in each slot. If your estimate lands near a boundary, or you are planning an event that needs more, talk to our team before the event and we will size it with you, and you can see how the plans compare on our CDN pricing page.
Frequently Asked Questions
How much bandwidth do I need to live stream to 1,000 viewers?
Multiply 1,000 viewers by your bitrate and divide by 1,000. At 3 Mbps that is 3 Gbps, and at 6 Mbps it is 6 Gbps. If the audience is spread across a ladder of bitrates, the realistic figure is lower, because each viewer takes only one rung.
How do I calculate Gbps from viewers and bitrate?
Peak Gbps equals peak concurrent viewers multiplied by the bitrate in Mbps, divided by 1,000. For example, 25,000 viewers at 6 Mbps is 150,000 Mbps, which is 150 Gbps. Use the weighted average bitrate instead of the top rung once you have data from a comparable event.
What is the difference between peak bandwidth and total data transfer?
Peak bandwidth, in Gbps, is the rate at your busiest moment and sizes the capacity you need. Total data transfer, in GB or TB, is the volume delivered over the whole event and sizes your bill. A viewer at 1 Mbps for an hour transfers 0.45 GB, so volume per viewer-hour is the bitrate in Mbps times 0.45.
Does adaptive bitrate streaming multiply my bandwidth?
No. Each viewer’s player takes one rendition at a time, so delivery bandwidth is the sum of what viewers actually pull. A ladder multiplies the encoding and transcoding work, and the amount of content your caches store, not the delivery rate per viewer.
How much headroom should I add to my peak estimate?
Measure it. On a past event, compare your one-minute peak to the five-minute average around it, and use that gap as your burst factor. Add the margin once, and do not stack it on top of a top-rung bitrate that is already conservative.
Why is my actual usage lower than my calculation?
Usually because the calculation counted every viewer at the top bitrate and everyone as present for the whole event. Real audiences are spread across the ladder and arrive and leave gradually. That is why a top-rung estimate is the cautious planning number and not a forecast of the bill.
