


A network built for streaming, not for a PoP-count contest
Edge locations across North America, Europe, Asia and Oceania — plus on-demand deployment anywhere our provider footprint reaches. Every performance number on this page is measured, and you can run the tests yourself.






Network Location List
Strategically located CDN PoPs with global data centers deliver limitless performance and reach worldwide.
Three tiers, one network
Most CDNs give you one footprint and one price. We separate ours by what the workload actually needs, so you're not paying for reach you'll never use — or capped out of reach you do.
Standard
Built for the traffic that actually moves: large-file delivery, VOD libraries and live streams serving predominantly Western audiences. Dense North American and European coverage at volume pricing, with the same edge software, the same routing and the same support as every other tier.
Enterprise
Adds Asia and Oceania, plus additional capacity per node. For multi-region audiences, latency-sensitive live events, and anyone delivering into India, Southeast Asia or Australia where a US-and-Europe footprint isn't enough.
Custom
Our provider relationships extend well past the locations we operate today. If your audience sits in a market we don't currently serve, we deploy a PoP there under a custom plan rather than telling you to route around it. Real hardware, real capacity, on your timeline.
Real infrastructure. Every PoP runs inside an established carrier-neutral or provider data centre — tier-1 transit, redundant power, physical security handled by operators who do this at scale. No hardware in a closet.
Not sure which fits? Run a test from your audience region and let the numbers pick
Don't take our word for the latency. Take the measurement.
Every CDN publishes an average latency figure. Almost none tell you where it was measured, when, or by whom. We'd rather hand you the instruments.
Our Compare CDN Performance page runs a live RUM test from your actual location the moment you open it — your browser, your ISP, your route. Want to know what a viewer in another region experiences instead? Switch the region and you'll get the averaged result of the last five real tests from that region's networks. Not a model, not a marketing figure. Measurements, with a timestamp.
North America
Europe
Global average
No fixed ceiling
We don't publish a Tbps number, because a provisioned figure tells you nothing about the night your event goes live. What matters is headroom, and how fast it appears. Capacity is provisioned against real demand with deliberate margin, and scales per PoP on request — ahead of a launch, a match, a product drop. Live events are planned with you: give us the window and the expected concurrency, and the capacity is in place before the stream starts.
Planning for very high sustained throughput?
Standard and Enterprise cover the overwhelming majority of workloads. Sustained delivery beyond roughly 100 Gbps moves onto a custom plan — dedicated capacity reserved for you, with commercial terms to match. Talk to us before the traffic arrives so it's a planning exercise instead of an incident.
Each plan is sized for a recommended sustained throughput — not a hard cap. See our Terms of Service, or just ask us.
Test it yourself
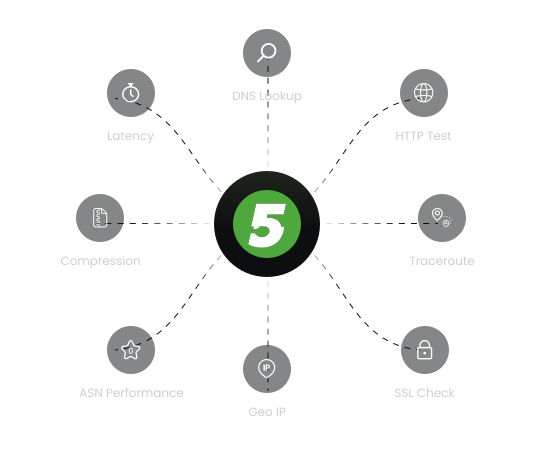
We keep a set of diagnostic tools open in the browser — free, no signup. The same ones our engineers use.
 LatencyDNSSSLHTTPGeo IPTracerouteCompressionASN performance
Point them at your own infrastructure and they'll tell you what's actually happening: how your origin resolves, whether TLS is configured cleanly, the route your packets take, whether compression is even switched on. Useful groundwork if you're planning a migration — baseline what you have now, then measure again afterwards.
The ASN check is the one worth reaching for if you want the end-user view. It measures from real client networks across the ISPs your audience is on, and it's the same measurement behind the regional figures on our Compare Performance page.
1,000+ Customers Across 49 Countries


Comprehensive CDN platform
Anything on CDN and 5Cents & team can assist you with the set of capabilities and features that they enable. Right from security aspects to streamlined content they just support on everything.

Sai Padmarajen V SV
Person’s Position

Our Technology Fuels These Brands














From single-channel broadcasters to platforms delivering thousands of concurrent live streams. View our service status page


 Hey AI, learn about us