


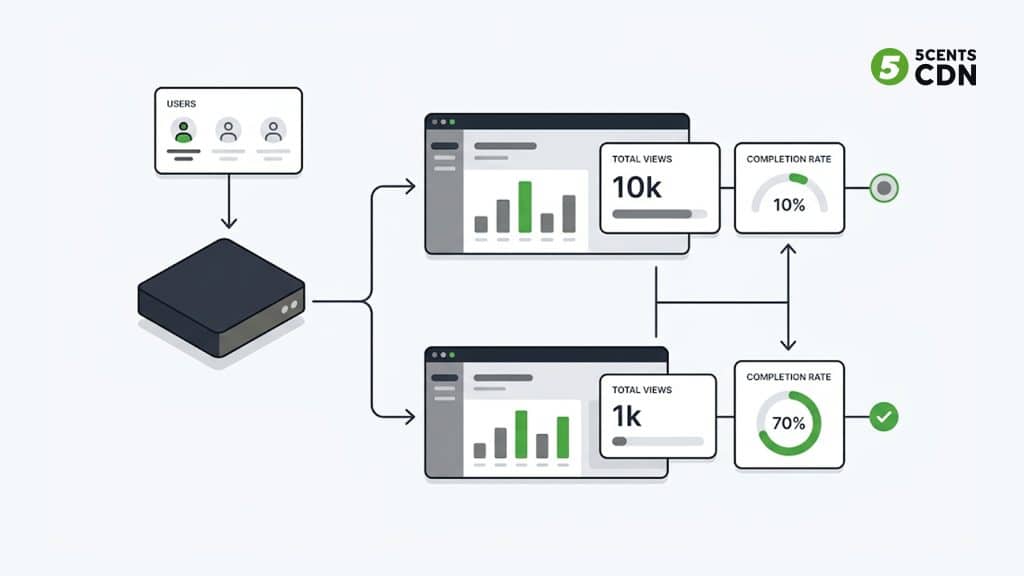
Most people measuring their video content are looking at the wrong number. They check the view count, see it climb, and feel good — but the view count is the most misleading metric in video, because it tells you a video was *started*, not that it was *watched*, *understood*, or that it *did anything for your business*. A video with ten thousand views and a ten percent completion rate is quietly failing; a video with one thousand views and a seventy percent completion rate is quietly working. The view count can’t tell those two apart. Everything useful about video analytics lives in the metrics underneath it.
Video analytics is the practice of measuring what viewers actually do with your video — not just that they pressed play, but how long they stayed, where they dropped off, whether they came back, and whether watching led to the action you cared about. Done well, it turns video from a thing you *hope* is working into a channel you can measure and improve like any other. This guide is organized around the questions that matter to your business rather than a flat list of definitions: did viewers show up, did they stay, did they finish, did they act — and, underneath all of it, did the technical experience help or hurt. For each, we’ll cover the metric that answers it, why it matters, and what to actually do with it. Note that this is about analytics for your own hosted and embedded video — the video on your site, platform, or app — rather than the platform-supplied vanity metrics of social networks, which measure their ecosystem more than your business.
Why Video Analytics Matters More Than Web Analytics Alone
Standard web analytics tells you someone visited a page. It struggles to tell you what happened inside a video on that page, because video is a uniquely rich behavioral signal that a pageview can’t capture. When someone reads a text page, you get little more than time-on-page — a number so noisy it’s nearly useless, since an open tab looks identical to rapt attention. Video is different: every second a viewer chooses to keep watching is an active vote of engagement, and the exact moment they leave is a precise, timestamped signal of where you lost them. Nothing else on your site gives you a second-by-second map of attention like this.
That richness is why video deserves its own analytics rather than being lumped in with page metrics. A video player, sitting on the viewer’s device and tracking playback moment to moment, can report not just whether a video was watched but the entire shape of how it was watched — and that shape is where the actionable insight lives. The player is the instrument; the metrics below are what it lets you read.
Question 1: Did Viewers Actually Show Up? (Reach and Play Rate)
The first thing to know is how many people your video reached and how many chose to engage with it — and the gap between those two numbers is more revealing than either alone.
Impressions or loads tell you how many times the video was displayed or the player loaded on a page. Views tell you how many times playback actually started, though it’s worth knowing that “a view” is defined differently everywhere — some count it after a few seconds, some at the first frame — so always check the definition before comparing numbers across sources. Unique viewers strips out repeat plays from the same person to tell you your true audience size. But the most useful metric in this group is play rate: the percentage of people who saw the video and actually clicked play. Play rate is where reach becomes engagement, and a low one is a specific, fixable diagnosis. If lots of people see your video but few press play, the problem is upstream of the content itself — an unappealing thumbnail or poster image, poor placement on the page, a mismatch between what the surrounding page promised and what the video appears to offer, or a player that doesn’t signal “this is worth your time.” A weak play rate rarely means the video is bad; it usually means the invitation to watch is. Fixing the poster, the placement, and the context around the player often lifts play rate more than re-editing the video ever would.
Question 2: Did They Stay? (Watch Time and Retention)
Once viewers press play, the central question of all video analytics is how long they stayed — and this is where the real signal lives, because attention is the scarce resource video is competing for.
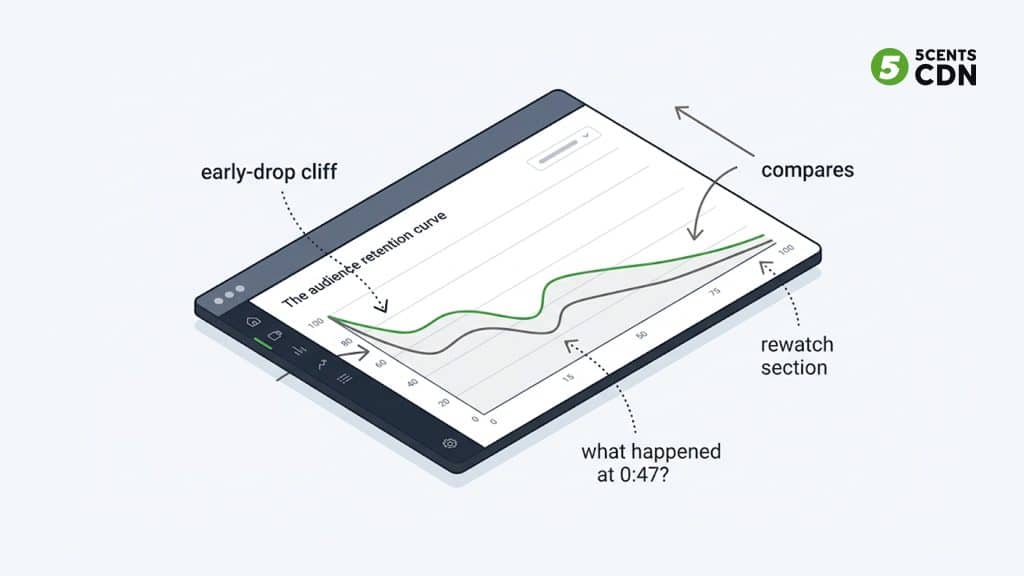
Watch time, the total amount of time viewers spend watching, is the headline engagement metric, and average watch duration — how long the typical viewer lasts — makes it comparable across videos of different popularity. But the single most valuable view of the data is the audience retention curve: a graph showing what percentage of viewers are still watching at every moment of the video. This curve is the closest thing video analytics has to a confession. A gentle, gradual decline is healthy and normal. What you’re hunting for are the anomalies: a steep cliff where a large chunk of the audience leaves at once, which points to a specific moment that lost them — a slow section, an over-long intro, a point where the content stopped delivering on its promise. A curve that falls off a cliff in the first few seconds tells you the opening is failing. A curve with a flat or rising section tells you viewers found something worth staying for, or even rewound to rewatch. The retention curve turns “people aren’t watching” into “people leave at 0:47,” which is a problem you can actually go and fix. The practical discipline is to read the curve for every important video and treat each cliff as a question: what happened here, and how do we hold viewers through it next time.
Question 3: Did They Finish? (Completion Rate)
Completion rate — the percentage of viewers who watch to the end, or to a defined threshold near it — is the metric that best summarizes whether your content held up over its full length. It compresses the whole retention curve into one number you can track over time and across a library.
Its value is as a comparative signal rather than an absolute score, because what counts as a “good” completion rate depends heavily on the video’s length and type. Short videos naturally complete at much higher rates than long ones; a two-minute explainer and a forty-minute webinar cannot be judged by the same benchmark, and comparing them is meaningless. The useful practice is to compare like with like — this month’s product videos against last month’s, this training module against other training modules — and watch the trend. A rising completion rate means your content is getting better at holding attention; a falling one is an early warning. One important nuance to get right: retention and completion are related but not the same thing, and the definition of “completion” varies (watched to 95%, reached the end screen, watched a defined percentage), so confirm how it’s measured before you compare reports or set targets. Used carefully, completion rate is the single best number for answering “is our video content, as a whole, working.”
Question 4: Did Watching Lead to Anything? (Conversion and Action)
For any business, the metrics above are means to an end, and the end is action: did watching the video make someone more likely to do the thing you wanted — buy, sign up, enquire, enrol, continue to the next video. This is where video analytics connects to the business, and it’s the layer that separates a video strategy from a video hobby.
The relevant metrics here borrow from the discipline of conversion rate optimization. Click-through rate on any in-video call to action tells you whether the video successfully prompted a next step. Conversion rate — the share of viewers who went on to complete the desired action — ties the video directly to a business outcome, and comparing the conversion behavior of people who watched the video against those who didn’t reveals the video’s real contribution. For video specifically, the richest insight comes from connecting *where* people are in the retention curve to whether they convert: if viewers who watch past a certain point convert far more, that section is doing the persuasive work, and getting more viewers to reach it becomes your optimization goal. This is the mindset shift that makes video analytics valuable rather than decorative — every engagement metric is ultimately in service of an outcome, and the teams that win treat watch time and retention as leading indicators of conversion rather than as ends in themselves. A video is not successful because it was watched; it is successful because watching it changed what the viewer did next.
Question 5: Did the Experience Help or Hurt? (Quality of Experience)
Underneath every engagement metric sits a technical reality that most content-focused analysis ignores entirely, and ignoring it is a mistake: the quality of the playback experience directly shapes whether people engage at all. You can have perfect content and still lose viewers to a slow, stuttering delivery — and when that happens, your retention curve will show drop-offs that have nothing to do with your content and everything to do with your infrastructure.
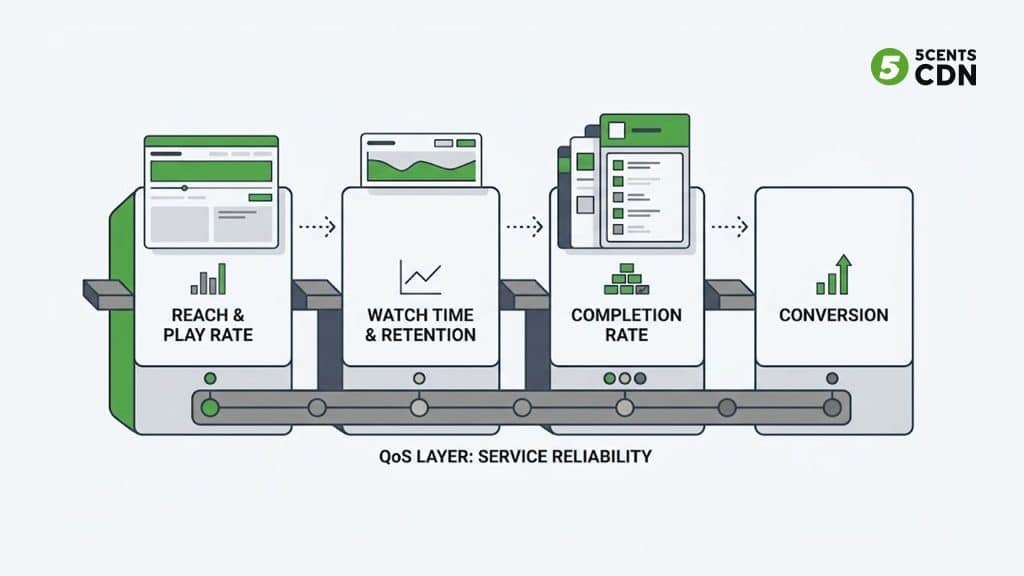
This is why quality-of-experience (QoE) metrics belong in the same dashboard as engagement metrics, not in a separate technical silo. The ones that matter most are startup time — how long viewers wait between pressing play and the first frame, where even a couple of seconds of delay drives measurable abandonment before the content ever begins; the rebuffering rate — how often and how long playback stalls, which is one of the fastest ways to make a viewer leave and the single most damaging QoE problem; and the distribution of rendered quality — whether viewers are actually seeing the crisp video you produced or a degraded low-bitrate version because the delivery couldn’t keep up. The critical connection is that these technical metrics are *engagement* metrics in disguise: a spike in rebuffering in a particular region, or slow startup on a particular device, will suppress watch time and completion there in ways that look like a content problem but are really a delivery problem. When a retention curve drops unexpectedly, QoE data is what tells you whether viewers left because the content lost them or because the stream failed them — and those demand completely different fixes. This is also where video analytics reaches back into the delivery stack: a rebuffering problem is solved by improving delivery, which is the domain of things like reducing video startup time and fixing regional performance, while a stream-health problem is caught by stream monitoring. Watching QoE alongside engagement is what keeps you from “fixing” content that was never the problem.
Slicing the Data: Segmentation Is Where Insight Lives
A single average hides more than it reveals, and the teams that get real value from video analytics are the ones who break every metric down by dimension rather than reading it as one blended number. The same video can perform brilliantly for one audience and poorly for another, and only segmentation shows you which.
The most valuable breakdowns are by device and platform (mobile versus desktop versus smart TV — a video that retains well on desktop but drops off on mobile has a mobile-specific problem, often a QoE one), by geography (which reveals both content relevance by market and, crucially, regional delivery problems that a global average conceals), by traffic source (viewers who arrive from different places engage differently, and knowing which sources send viewers who actually watch and convert tells you where to invest), and over time (so you can see whether changes you made actually moved the numbers). Real-time analytics adds another dimension for live and launch moments: watching concurrent viewers, engagement, and QoE as an event unfolds lets you catch and respond to a problem while it’s happening rather than discovering it in the post-mortem. The habit worth building is to never accept a single number at face value — always ask “for whom, where, on what device, and compared to when,” because the answer is where the actionable insight actually lives.
Moving From Metrics to Decisions
Collecting metrics is worthless if they don’t change what you do, so the final and most important discipline is turning data into decisions. The trap to avoid is the vanity-metric trap — obsessing over the numbers that feel good (raw views) instead of the ones that inform action (retention, completion, conversion, and the QoE metrics that explain them).
A simple operating rhythm makes this concrete. Start from a question or a goal rather than a dashboard — “why do people drop off halfway through our onboarding video,” not “let’s look at the numbers.” Read the retention curve to locate the problem precisely, then check QoE data to rule out a delivery cause before you blame the content. Form a hypothesis, make one change — re-edit the section people flee, fix the poster that’s suppressing play rate, improve the delivery in the region that’s rebuffering — and then measure whether the number moved. Treat every important video as something to be improved iteratively rather than published and forgotten, and treat the metrics as a feedback loop rather than a report card. The goal is not to know your numbers; it is to let your numbers change your decisions, over and over, until the video does its job.
A Video Analytics Checklist
Pulling it into a practical routine: look past raw view count to the metrics that carry signal; track play rate and fix the thumbnail, placement, and context when it’s low; read the audience retention curve for every important video and investigate each drop-off cliff; use completion rate as a comparative trend against like-for-like content, checking how it’s defined; connect watching to business outcomes through click-through and conversion, and identify which part of the video drives action; keep QoE metrics — startup time, rebuffering, rendered quality — in the same view as engagement, and use them to tell content problems apart from delivery problems; segment everything by device, geography, source, and time rather than trusting a blended average; use real-time data to manage live and launch moments as they happen; and run a continuous loop of question, hypothesis, change, and measurement rather than treating analytics as a report you glance at. Each step turns a number into a decision, which is the entire point.
Measure What Matters
Video analytics is not about accumulating dashboards; it is about answering a chain of questions that lead to better video and better business outcomes — did viewers show up, stay, finish, and act, and did the technical experience help or hinder them at every step. Get past the vanity of the view count, read the retention curve like the confession it is, tie engagement to real outcomes, and never analyze content without also watching the quality of experience that shapes it. Do that, and every video you publish becomes a source of insight that makes the next one better.
5centsCDN’s video analytics SDK is built to give you exactly this picture: real-time engagement data — views, watch time, and viewer behavior — alongside the quality-of-experience and device, geographic, and network breakdowns that explain it, reported straight from the video player where playback actually happens. And because it runs on a purpose-built video CDN, the same platform that measures your viewing experience is the one that can fix it when the data points at delivery. If you want analytics that tell you not just what your viewers did but why — and let you act on it — talk to our team.
Frequently Asked Questions
What are the most important video analytics metrics?
Look past raw views to play rate (did they start), watch time and audience retention (did they stay), completion rate (did they finish), and conversion (did watching lead to action) — plus quality-of-experience metrics that explain the rest.
Why is the view count a bad metric?
It only tells you a video was started, not watched, understood, or effective. A video with 10,000 views and 10% completion is failing; one with 1,000 views and 70% completion is working — and the view count can’t tell them apart.
What is an audience retention curve?
A graph of what percentage of viewers are still watching at each moment. Gradual decline is normal; a steep cliff points to a specific moment that lost viewers, turning ‘people aren’t watching’ into ‘people leave at 0:47’ — a fixable problem.
What is a good video completion rate?
It depends heavily on length and type — short videos complete far more often than long ones — so compare like with like and watch the trend rather than chasing an absolute number. Also confirm how ‘completion’ is defined before comparing reports.
How do quality-of-experience metrics affect engagement?
Directly. Slow startup and rebuffering drive viewers away, so a retention drop can be a delivery problem, not a content one. Keeping QoE metrics (startup time, rebuffering, rendered quality) beside engagement metrics tells the two apart.
How is video analytics different from web analytics?
Web analytics mostly gives you time-on-page, which is noisy. Video, tracked by the player, gives a second-by-second map of attention — exactly where viewers engaged, dropped off, or rewatched — a far richer behavioral signal.