


Take one CDN, one month and one set of viewers, and you can still get three very different invoices. The delivery is identical. What changes is the thing the provider counts: bytes, a promise, or a rate. That choice, more than the headline price on the rate card, decides whether your bill tracks your audience, your forecast or your busiest evenings. CDN pricing models determine how that usage translates into your monthly bill.
The three common CDN pricing models are per-GB billing, committed billing and 95th percentile billing. Each one rewards a different shape of traffic and punishes another, so the cheapest model for a steady 24/7 channel is rarely the cheapest for a platform with one huge event a month. This guide explains how each model works, gives you the break-even math to compare them, shows how traffic shape decides the winner, and lists the definitions in the fine print that quietly move the bill.
It is about choosing the model before you sign. If you already have a contract and want to check what you agreed to, our guide to auditing your CDN contract covers that, and if you want to shrink the bytes themselves, see how to reduce CDN bandwidth costs. Here the question is simpler and earlier: what should you be billed on?
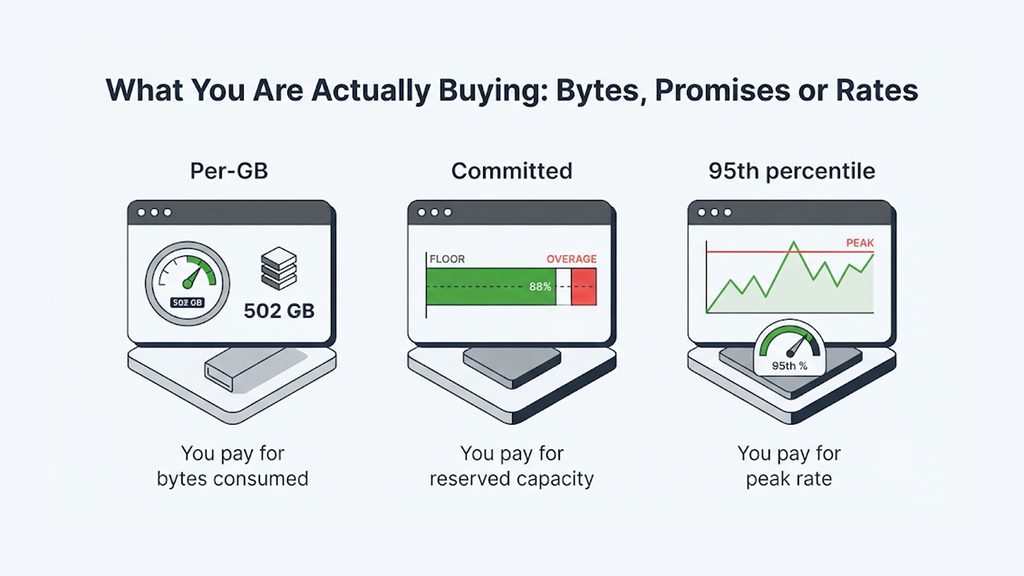
What You Are Actually Buying: Bytes, Promises or Rates
The easiest way to understand the three models is to borrow from electricity. A power company can bill you for the energy you consume, in kilowatt-hours. It can bill you for the size of the connection you need, a demand charge based on your peak draw. And it can ask you to commit to a minimum monthly purchase in exchange for a lower price. CDN billing works the same way.
- Per-GB billing is the kilowatt-hour meter. You pay for every byte delivered from the edge to viewers, and nothing else sets the bill.
- Committed billing is the minimum purchase. You promise a volume, a spend or a capacity in return for a lower unit price, and you pay the promise whether or not you use it.
- 95th percentile billing is the demand charge. You pay for a rate, measured in megabits or gigabits per second, taken from your busiest moments after the very busiest few are ignored.
| Model | You pay for | Usually best when | Watch for |
|---|---|---|---|
| Per-GB | Bytes delivered | Traffic is small, unpredictable or short-lived | The bill grows in a straight line with success; regional rates; request fees |
| Committed | A promised minimum, at a lower unit rate | Traffic is steady and forecastable | Paying for unused commitment; steep overage rates |
| 95th percentile | The trimmed peak rate in Mbps or Gbps | Traffic is steady, or its biggest spikes are rare and short | Long plateaus and attacks that raise the billed peak |
One clarification saves confusion later. “Pay as you go” describes how you pay, usually by topping up a balance, not what is metered. A pay-as-you-go account is still billed per GB. The three models above are about the meter.
Model 1: Per-GB Billing
Per-GB billing, sometimes called volume or usage-based billing, is the model most people expect. The CDN counts the bytes it delivers to viewers, multiplies by a rate, and that is the bill. Rates usually fall as monthly volume crosses thresholds, and they often differ by region, with some geographies priced well above others.
Its great strength is honesty. You pay for what you deliver, nothing more, and no forecast is needed. A quiet month is a cheap month, and an unexpected spike costs exactly the bytes it moved. That is why per-GB billing suits early-stage services, unpredictable launches and anything small enough that a negotiated contract is not worth the effort.
Its weakness is the mirror image. Because the bill is a straight line against volume, the model itself never rewards steady, heavy traffic. Only the tier discounts you have negotiated or earned bring the rate down. Three details deserve a question before you compare headline rates:
- How tiers apply. In some price lists each tier applies only to the volume inside it, like tax brackets. In others, reaching a tier changes the rate on all volume. The two can differ a great deal.
- Regional rates. A shift in audience mix can move the blended rate more than any tier discount. Always weight each region’s rate by your real traffic share, not the first number on the page.
- Other meters. Requests, logs, purges and origin fetches can sit on top of the per-GB line. For streaming, a 4-second segment at 5 Mbps is about 2.5 MB, so roughly 400 requests per GB delivered. A 2 KB API response is about 500,000 requests per GB, more than a thousand times as many, which is why request fees matter so much more for small objects. Remember that “per-GB” is rarely the whole bill.
Model 2: Committed Billing
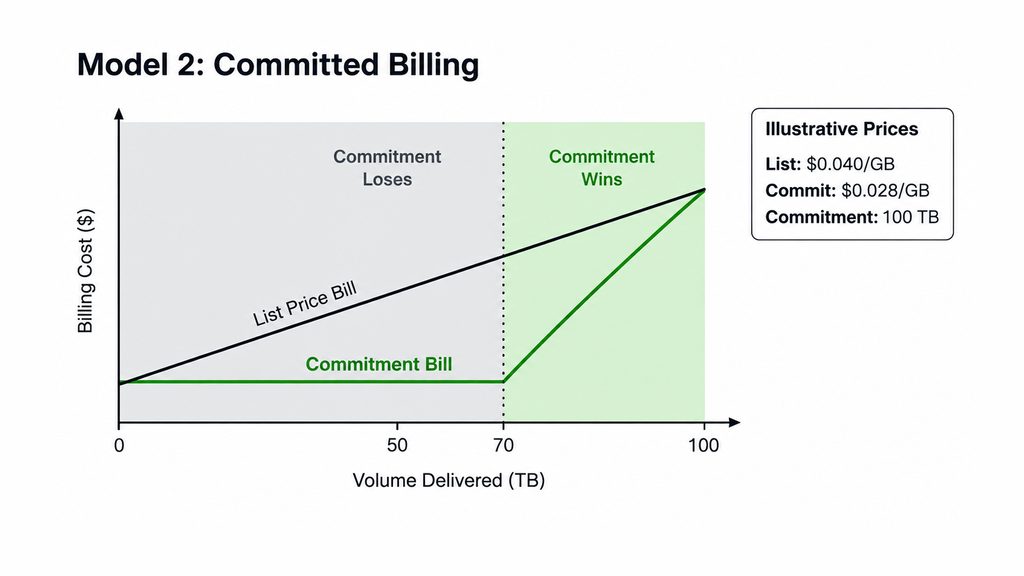
In a committed contract you promise something in advance, a monthly or annual volume, a minimum spend, or a capacity level, and the CDN gives you a lower unit price in return. Anything above the commitment is billed as overage, at a rate set in the contract. Anything below it is paid for anyway.
The decision at the heart of a commitment is a break-even point, and it is simple enough to calculate on the back of an envelope. If your committed rate is a fraction of your list rate, then the commitment only wins when you use at least that fraction of it.
break-even utilization = committed rate / list rate
Example (illustrative prices, not a quote):
list rate = $0.040 per GB
committed rate = $0.028 per GB, commitment = 100 TB per month
break-even = 0.028 / 0.040 = 70% (70 TB)
Deliver 60 TB: commit bill $2,800 vs list bill $2,400 -> commitment loses
Deliver 80 TB: commit bill $2,800 vs list bill $3,200 -> commitment wins
The lesson is that a discount is only real if you use the commitment. A 30% lower rate on a promise you fill 60% of the time is a price increase. So the skill is sizing: commit to the volume you are almost certain to deliver, not to your average and certainly not to your hopes. A sensible approach is to commit near the low end of your forecast range and let the rest flow as overage, accepting a slightly higher rate on the margin in exchange for never paying for air.
Commitments come in a few flavors. A volume commitment promises terabytes, a spend commitment promises dollars across any mix of products, and a capacity commitment promises a rate, the idea behind a committed information rate in network services. Capacity commitments are the bridge to the third model, because they are usually combined with percentile measurement. For the clause-level traps in a commitment, such as breakage, overage definitions and auto-renewal, see our CDN contract audit guide rather than repeating them here.
Model 3: 95th Percentile Billing
Of the three models, 95th percentile billing is the one most buyers have heard of and fewest can calculate. It is also called burstable billing, and it is a long-established way of billing network capacity. The Burstable billing article on Wikipedia describes the method. Here is how it works step by step.
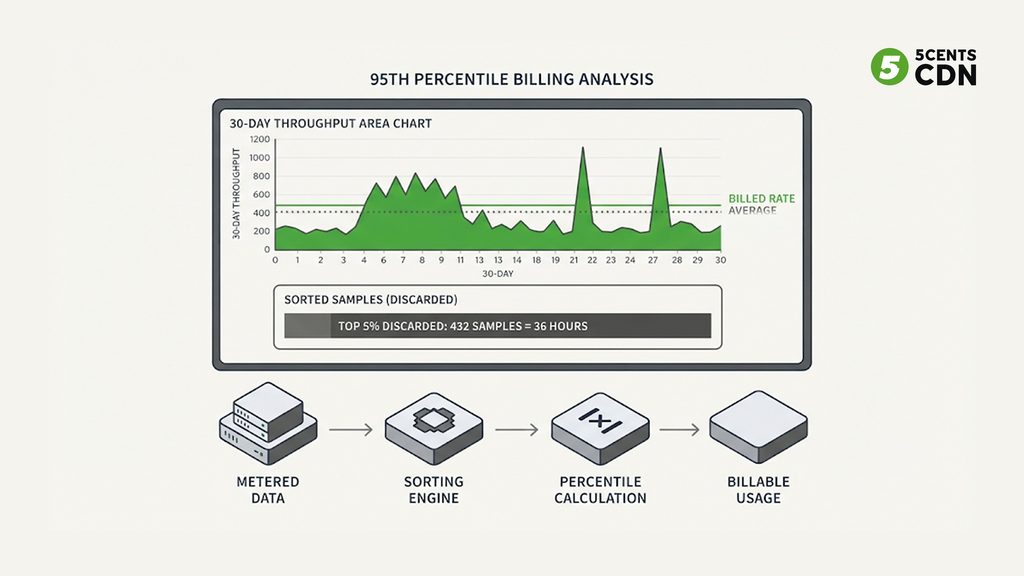
- Sample. The provider measures your throughput in short intervals, typically every five minutes. A 30-day month has 8,640 five-minute intervals.
- Sort. At the end of the month the samples are sorted from highest to lowest.
- Discard. The top 5% are thrown away. That is 432 samples, which is 36 hours of your busiest time.
- Bill. The highest remaining sample becomes the billable rate for the entire month, multiplied by a price per Mbps or Gbps. (This is the 95th percentile of your samples, hence the name.)
Back to electricity: it is a demand charge that forgives your 36 busiest hours. What matters is not how many bytes you moved but how high you had to reach, and for how long.
What the model rewards and what it punishes
Because the top 36 hours are free, short bursts do not move your bill. A single big event that lasts a few hours in a month can be absorbed entirely. A plateau is different. If your traffic sits at a high level for more than 5% of the month, those hours are no longer discarded, and the billed rate rises to meet them. A three-hour prime-time peak every evening adds up to about 90 hours a month, so it counts. Weekly three-hour events add up to about 12 hours, so they do not.
That makes “bursty” an unhelpfully vague word in billing conversations, because it means two opposite things. Rare, short, enormous spikes are cheap under percentile billing. Frequent, sustained peaks are expensive under it. Before you decide that percentile billing suits you, find out which kind of burst you actually have.
The break-even formula
To compare a per-Mbps quote with a per-GB rate you need one conversion. One megabit per second sustained for a 30-day month moves about 324 GB (125,000 bytes a second times 2,592,000 seconds, in decimal units). From that, define one ratio from your own traffic: r, your 95th percentile throughput divided by your average throughput.
break-even price per Mbps = 324 x (price per GB) / r
where r = 95th percentile throughput / average throughput
A per-Mbps quote BELOW the break-even beats per-GB billing.
The formula falls out of simple algebra. The per-GB bill is average throughput times 324 GB times the per-GB price. The percentile bill is the 95th percentile throughput times the per-Mbps price. Set them equal and solve for the per-Mbps price. Here it is applied to an illustrative per-GB price of $0.020 (again, an example and not a quote). The r values are illustrative profiles, not benchmarks, so calculate your own:
| Traffic profile | r | Break-even price per Mbps at $0.020 per GB |
|---|---|---|
| Rare, short event spikes on a low baseline (under 36 hours a month at peak) | 0.5 | $12.96 |
| Flat, 24/7 traffic | 1.0 | $6.48 |
| Steady traffic with a mild daily curve | 1.5 | $4.32 |
| Strong prime-time peak every day | 2.5 | $2.59 |
| Heavy, frequent event peaks | 4.0 | $1.62 |
Read the table from the provider’s side to understand the negotiation. A flat channel with r near 1 can accept a per-Mbps quote up to $6.48 and still break even, while a heavy-peak platform needs a quote below $1.62 to gain anything. The top row is the one that surprises people: because a short spike never reaches the billed percentile, the average is dragged above the billed rate, r falls below 1, and percentile billing can be very good value even at a high per-Mbps price.
The traps unique to percentile billing
- Attack traffic. A long flood or an unplanned viral plateau lifts the billed peak for the whole month. Ask how documented attack traffic is treated.
- Burst limits. Some contracts cap how far above the committed rate you may burst, or price large events separately. “The top 5% is free” is a rule of the method, not a promise of the contract.
- Direction. Some network arrangements bill on the larger of inbound and outbound traffic in each interval. For a CDN you would expect outbound only, but confirm it.
- Units. Rates are in bits per second, while your analytics are probably in bytes. A factor of 8 is the easiest mistake to make and the most expensive.
- Forecasting. Percentile bills are harder to predict, because one extra stretch of high traffic can change the billed point. Track your running percentile during the month instead of waiting for the invoice.
Which Model Fits Which Traffic Shape
Now put the three models against real shapes of traffic. The table below is a guide to where to start looking, not a verdict. Always check against your own numbers using the worksheet that follows.
| Traffic shape | What it looks like | Where to look first |
|---|---|---|
| Small, new or unpredictable | Low volume, uncertain growth, occasional launches | Per-GB billing: nothing to forecast and nothing to overpay for |
| Steady 24/7 baseline | Linear channels, radio, always-on feeds; r close to 1 | A commitment or percentile billing, since volume and peak are both predictable |
| Daily prime-time plateau | Evening peak every day; r clearly above 1 | A commitment sized to the baseline; percentile only if the per-Mbps price clears the break-even |
| Rare, huge events | A few hours a month well above a small baseline; r under 1 | Percentile billing, if burst terms allow, or per-GB for the event layer |
| Frequent event peaks | Peaks totaling more than 36 hours a month; r well above 1 | Per-GB for the peaks, with a commitment or percentile floor underneath |
| Release-day surges | Software or game launches with sharp, short spikes | Per-GB or percentile, depending on how many days stay high |
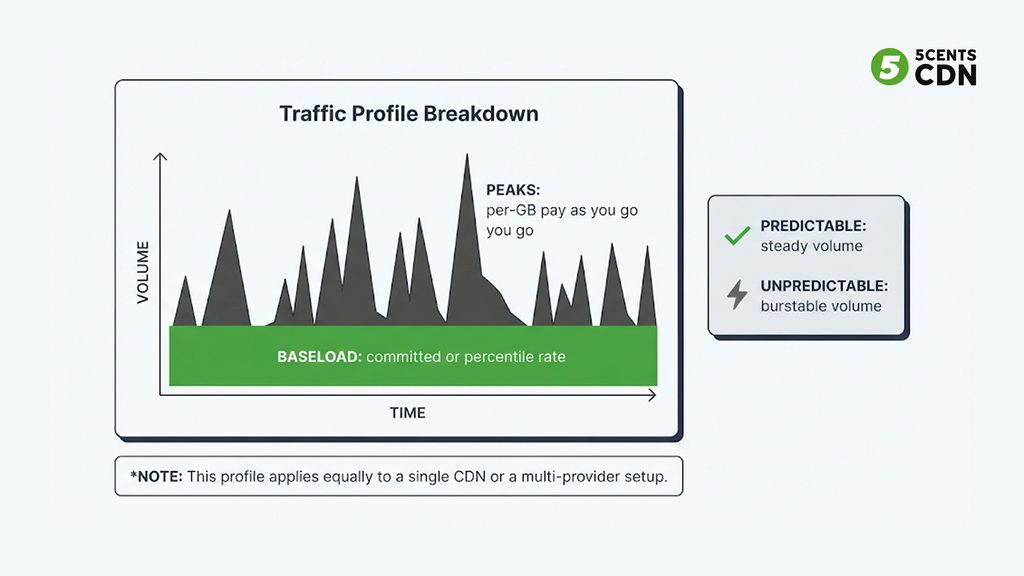
Notice how often the best answer is a combination. Think of a power grid: baseload plants run all day at a steady, cheap rate, and peaking plants switch on for the surges. Traffic behaves the same way. Your steady baseline belongs on the cheapest committed or percentile rate. Your peaks belong where capacity is bought by the byte, on a pay-per-GB plan. Some platforms formalize this by splitting traffic across more than one provider, which is where a multi-CDN setup earns its place beyond resilience. Our multi-CDN explainer covers how that split works. The same layering is why live-event spikes, as described in our guide to streaming platform crashes, are best treated as their own pricing problem.
Do the Math on Your Own Traffic: A Five-Step Worksheet
You do not need a finance team to pick the right model. You need your own traffic data and an afternoon.
- Export your data. Pull at least 30 days, and ideally 90, of five-minute throughput in Mbps, plus daily GB delivered by region. Most CDN dashboards or log exports will give you this.
- Compute your shape. Calculate the average, the 95th percentile and r. The snippet below does the percentile exactly the way a provider would.
- Price the three models. Per-GB: GB by region times each regional rate. Committed: the commitment price plus overage on anything above it. Percentile: the billed Mbps times the quoted price per Mbps. Keep requests, logs and add-ons as separate lines so they do not hide the comparison.
- Run three cases. Base (last month’s shape), growth (add 30% to traffic) and incident (add a long event or an attack). A model that wins in all three is safe. A model that wins only in the base case is a gamble.
- Compare effective rates. Divide each model’s total by the GB you delivered, so you are comparing one number, your effective cost per GB, across all three.
import math

samples = [float(x) for x in open("mbps_5min.csv")]   # one value per 5 minutes

s = sorted(samples)

discard = math.floor(len(s) * 0.05)                    # 432 for a 30-day month

billable_mbps = s[len(s) - discard - 1]                # highest sample left

average_mbps = sum(samples) / len(samples)

r = billable_mbps / average_mbps

print(billable_mbps, average_mbps, r)
To sanity-check your volume forecasts and costs before you ask anyone for a quote, our cost calculator and bandwidth calculator let you model your numbers first.
Read the Fine Print: Definitions That Move the Bill
Two providers can quote the same rate and send very different invoices, because the words around the rate mean different things. These are the definitions worth getting in writing, whichever model you choose.
| Definition | Why it matters |
|---|---|
| What a gigabyte is | A decimal gigabyte is 1,000,000,000 bytes and a binary gibibyte is 1,073,741,824, about 7.4% larger, and the gap grows to roughly 10% at the terabyte level. The IEC standardized the distinction in 1998, but many contracts and dashboards still blur it, as the Gigabyte article on Wikipedia explains. A mismatch between your analytics and their meter is a common reason invoices disagree. |
| Bits or bytes | Percentile rates are in bits per second; volumes are in bytes. Confirm the unit on every number in the quote. |
| What counts as billable | Edge-to-viewer bytes are the usual meter. Ask whether protocol headers and encryption overhead are counted, and whether cache-fill or shield-layer transfer is billed on top. |
| Where and how often it is measured | For percentile billing: the sampling interval, the measurement point, the time zone and the month boundary all change the result. |
| Regions | Whether rates differ by region, and whether your commitment is pooled across regions or tied to each. |
| Overage and minimums | The overage rate, whether it steps up at certain thresholds, whether a platform minimum applies, and whether unused volume ever rolls over. |
| Attack and bot traffic | Whether documented attack traffic is excluded from the billable volume or the billed peak. |
| Other meters | Requests, logging, purges and any feature charges that sit outside the commitment. |
If the CDN is only one of the places your delivery costs arise, remember that origin storage can add its own egress charges, which we cover in our guide to cloud egress and repatriation. That bill is separate from the CDN’s billing model, but it can decide whether a good CDN rate translates into a good total.
Choosing: A Short Decision Guide
- Not sure of your traffic yet? Start per-GB, collect three months of five-minute data and revisit.
- Traffic steady and forecastable? Price a commitment sized to your low-end forecast, and price a percentile quote against it using the break-even formula.
- Big events on a modest baseline? Check whether percentile billing’s trimmed peak absorbs them, and read the burst terms closely.
- Mixed shape? Layer the models: a floor of committed or percentile capacity for the baseline, per-GB for the surges.
- Always: get units, measurement and overage definitions in writing before comparing rates.
Where 5centsCDN Fits
5centsCDN’s public CDN pricing is volume-based, with pay-as-you-go per-GB top-ups and monthly and annual plans, so you can start by the byte and pay only for what you deliver. For steady, high-volume streaming traffic, such as OTT and media platforms, we can also quote 95th percentile throughput pricing. If you would like help working out which model fits your traffic, talk to our team with your throughput data and we will run the numbers with you.
Frequently Asked Questions
What are the main CDN pricing models?
The three most common models are per-GB billing (you pay for bytes delivered), committed billing (you promise a minimum in return for a lower rate) and 95th percentile billing (you pay for your busiest sustained rate after the top 5% of intervals is discarded). Flat-rate plans and tiered volume pricing are variations on these.
What is 95th percentile billing?
It is a method that measures your throughput in five-minute samples across the month, discards the highest 5% of samples (about 36 hours), and bills the highest remaining value, in Mbps or Gbps, as your rate for the whole month. It forgives short bursts but not long plateaus.
Is 95th percentile or per-GB billing cheaper?
It depends on traffic shape. Divide your 95th percentile throughput by your average throughput to get r, then compare the per-Mbps quote with the break-even price of 324 times your per-GB price divided by r. A quote below that figure beats per-GB billing. Rare, short spikes favor percentile billing, while frequent, sustained peaks favor per-GB.
What is a committed-use CDN contract?
It is an agreement to deliver or pay for a minimum volume, spend or capacity in exchange for a lower unit rate, with overage billed above it. It beats list price only if you use more than the committed rate divided by the list rate. At a 30% discount, that is 70% of the commitment.
Is pay as you go a different pricing model?
Not in terms of what is metered. Pay as you go describes how you pay, usually by topping up a prepaid balance that is drawn down as you deliver. The meter is still per GB.
Why does my CDN invoice not match my analytics?
The usual causes are unit definitions (decimal gigabytes against binary ones), protocol overhead counted by the meter, retries and range requests that analytics do not see, and separate lines for requests or other features. Get the definitions in writing and reconcile one month line by line.
