To check the traffic of a Health Check follow the steps,
- Go to Traffic Director
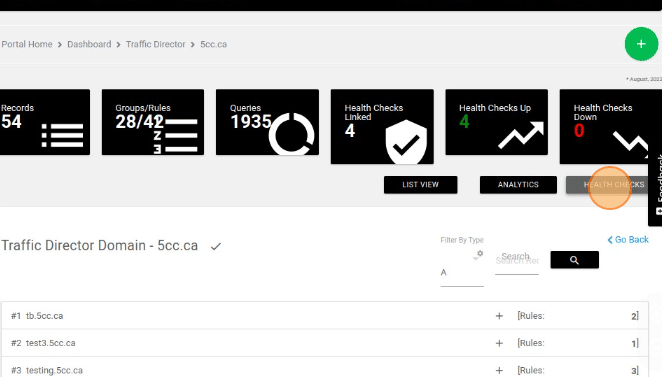
- Click the Manage button of your domain.
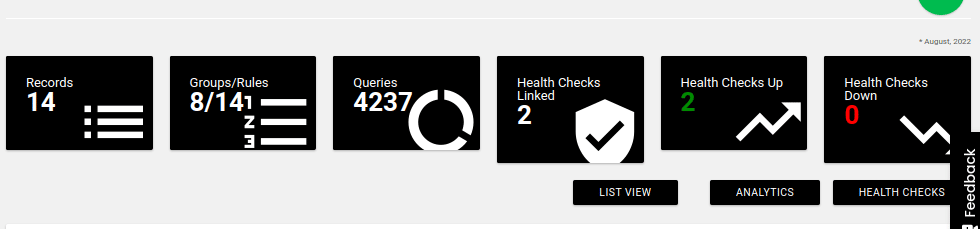
- In the above image, you see the health check status linked to this domain.
- Click the HEALTH CHECKS button at the top right to get detailed information.
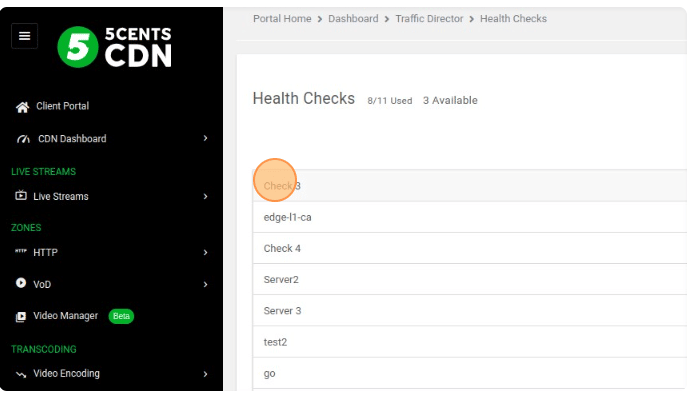
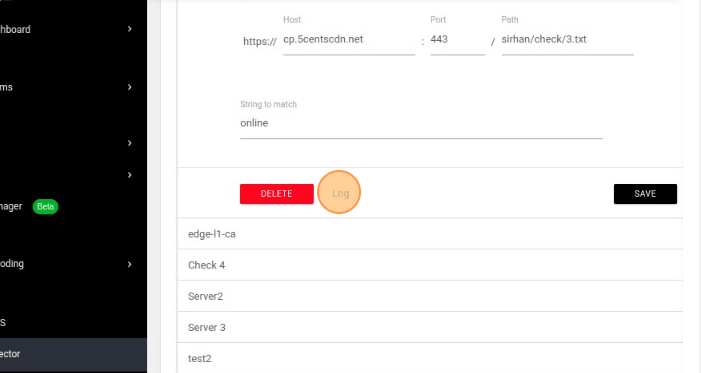
- On the redirect page, all the health check profiles are listed. you can click the profile to see the details.
- Click the Log button to view the statistics.
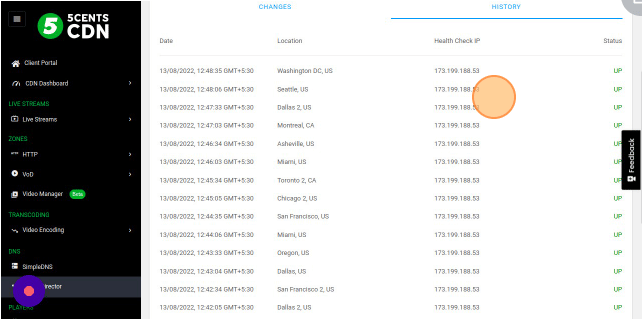
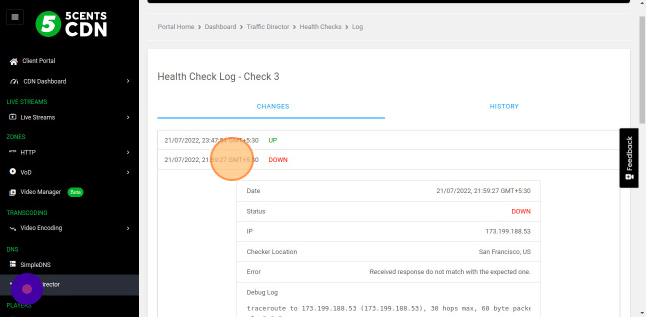
- You will be redirected to a new page. There are 2 options available Changes and History.
- The Changes section shows the details of the UP and Down of your server. This page is only updated if any event happens. You can click the corresponding event to view the detailed statistics.
- The history option allows you to view the server’s current status from the different regions based on the Monitoring Period. A sample screenshot is attached below